Quality comes first. Analyzing quality across worker shifts accurately can go a long way in tracking your operational productivity.
When you measure your workers productivity or quality performance and discuss your findings with them, you set the right expectations and progress toward achieving individual goals that are aligned with company goals.
In addition to this, these measurements can also reveal where the workflow is getting slowed down or where a particular productivity bottleneck exists.
What if you had:
- Access to worker shift performance reports with accurate yield, quality & defect rates?
- A detailed Root Cause Analysis pointing out the quality concerns at every stage across each shift?
- A comprehensive Process Behaviour Chart to benchmark against operational resolutions to monitor process stability?
ThroughPut’s AI-enabled Operational Excellence Product ELITE can help you prioritize shift focus and resource allocation to accelerate output gains. ELITE helps you dig down deeper to cull out work performance and shift inefficiencies at core.
The questions that ThroughPut AI helps you answer in workers productivity:
- What does the average shift performance graph look like?
- What is the yield and defect rate improvement potential and root causes for inefficiencies?
- Where should you pull resources from if you need to free up people to address these root causes?
- Which are those optimum time periods where your operations are running the smoothest?
- What are the shift periods with the lowest defect rates?
Here is how it works?
By keying in a few important details about your existing operational shift quality data you can get an accurate analysis of your worker productivity performance:
Input
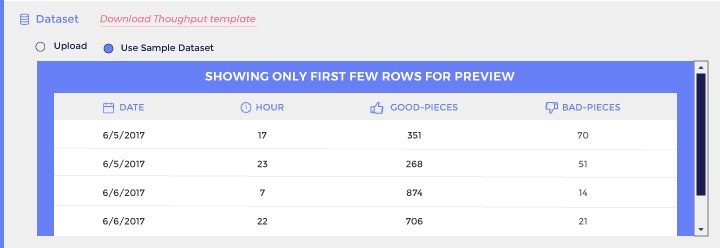
Step 1- Upload your existing dataset which highlights the Hourly logs of Good / Bad Pieces

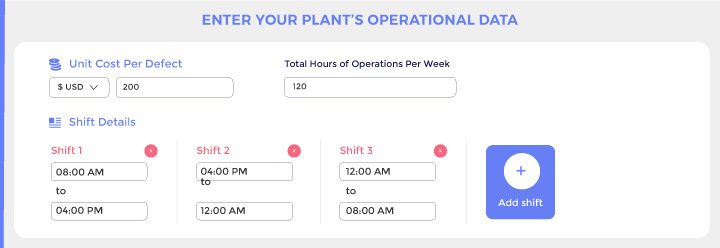
Step 2 – Enter your plant’s Operational Data- Total cost per defect + Operations hours/ week + Shift Details

Analyze your Operations – the Output
- Analyze the Average Shift Performance with the Average Defect Rate highlighted.

- Analyze the Shift Performance Visualization to understand the change in defect rate behavior across all shifts.


