18 Best Supply Chain Analytics Software Solutions to Improve Business Efficiency
Supply chain analytics software combines powerful algorithms, data, and the latest technologies like Artificial Intelligence and Machine Learning to address the most elusive challenges in the supply chain right now – visibility and control.
Think of supply chain analytics as your strategic advantage, like catching that perfect wave early in the surfing game. In the ever-changing business landscape, those who get in on the action before the crowd can claim a competitive edge. And that’s precisely what’s on the horizon for supply chain analytics. Given that the supply chain is an industry characterized by constant flux, surprises, and an intricate web of moving parts – supply chain analytics steps in as the all-powerful enabler.
By 2032, the supply chain analytics market is expected to reach USD 38.78 billion. Today, we are at USD 7.41 billion. The 18% estimated Compound Annual Growth Rate (CAGR) comes as no surprise, given the game-changing potential of supply chain analytics.
From leaders to the dedicated folks on the front, supply chain analytics equips everyone to meet their performance goals (those famous KPIs) and get business revenues and growth into high gear.
So, what’s the game plan here? This piece will unveil the top 18 supply chain analytics solutions currently shaking up the market. These aren’t just tools but potential game-changers for your bottom line in the long run. But remember, your choice depends on your specific puzzle, supply chain strategy, and what you’re already packing in your toolkit.
Ready to dive in?
What is Supply Chain Analytics Software?
In the simplest terms, supply chain analytics empowers you to make intelligent decisions based on facts, not gut feelings. Supply chain analytics integrates and evaluates data from across your supply chain to draw actionable insights that can help you optimize your supply chain operations.
Considering your supply chain has large volumes of data lying in siloed systems, supply chain analytics software is like a supercharged information engine that gathers and dissects data from every nook and cranny of your supply chain, which may otherwise not be humanly possible.
Let’s face it – your supply chain is a treasure trove of data scattered across various systems like pieces of a puzzle waiting to be pieced together. This is where supply chain analytics software steps in, conjuring insights faster and with greater precision than human capabilities can muster. It often conjures up those nuggets of wisdom that might have slipped past even the sharpest human eye.
This magic isn’t confined to just one corner of your business. Supply chain analytics software is a versatile tool that stretches its influence across the entire spectrum. From keeping tabs on inventory levels and production schedules to orchestrating order fulfillment, managing transportation, and evaluating supplier performance – it’s your one-stop shop for tracking many events and activities.
So, what features should you look for in your supply chain analytics tool?
What are the Key Features and Functionalities of Modern Supply Chain Analytics Tools?
Supply chain analytics tools offer a wide range of features and functionalities to support effective supply chain management, but there are some non-negotiable ones to look out for:
- Data visualization: Supply chain analytics software must provide interactive visualizations and dashboards, making it easier to understand complex data and identify patterns, trends, and outliers.
- Real-time monitoring: Supply chain analytics software must provide real-time data, alerts, and notifications to enable proactive decision-making and response to unexpected events.
- Data integration capabilities: Your supply chain generates data from various sources – inventory systems, production lines, transportation networks, etc. Top-tier analytics software should seamlessly integrate data from these disparate sources, offering a unified view of your entire supply chain.
- Integration of external data: An effective supply chain analytics software must also be able to access and analyze data from external sources like weather forecasts, social media trends, etc.
- Latest analytics: Supply chain analytics software must have predictive and prescriptive analytics capabilities to help you predict the future and provide actionable recommendations to manage future scenarios.
- Machine Learning and AI integration: Machine Learning and Artificial Intelligence enhance the software’s analytical capabilities. These technologies can uncover patterns, anomalies, and correlations within the data that might not be apparent through traditional analysis methods.
What are the Best Supply Chain Analytics Software Solutions?
Many excellent supply chain analytics software or tools in the market differ in features, focus areas, visualizations, and other vital elements. What you need for your business will depend on the problem you are trying to solve, your existing capabilities, and your budgets.
Based on our experience, here are the top supply chain analytics software solutions you can evaluate in the market today.
- ThroughPut AI
- Palantir Foundry
- SAP Supply Chain Analytics Software
- Oracle Fusion SCM Analytics
- Blue Yonder
- Manhattan Associates
- Tableau
- GMDH Streamline
- IBM Supply Chain Analytics
- Supply Chain Guru X by Coupa
- Kinaxis RapidResponse
- O9 Solutions
- Anaplan
- Qlik
- SAS Supply Chain Analytics
- Aera Technology
- Conversight
- Tredence
Let’s have a closer look at each one.
1. ThroughPut
Overview: ThroughPut is an AI-powered supply chain intelligence software that leverages your existing data to diagnose improvements within your supply chain with the fastest and highest ROI. From demand to capacity, product, customer, and logistics, ThroughPut studies your entire supply chain ecosystem to recommend the best and most impactful solutions. Its AI-powered capabilities make it a tool that can be used in real-time to accommodate real-time shifts, fluctuations and disruptions.

Main Features:
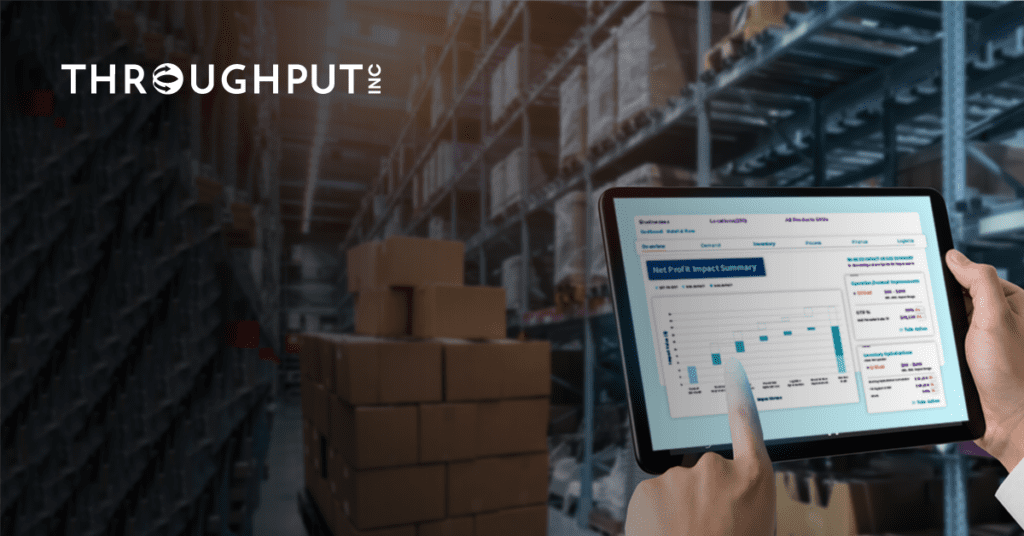
- Net profit summary view that helps businesses connect the dots between finance and supply chain operations
- Quick diagnostic capabilities to identify improvements with the fastest ROI
- Customizable visualizations with real-time simulations for root cause analysis
- End-to-end visibility with holistic system optimization
- Single source of truth for data-driven decisions
Main Benefits:
- Recognized as a top-rated supply chain optimization solution
- Fast implementation cycle (5-30 days)
- Ability to report on free cash flow, revenue and working capital
- Adaptable to any business environment
- Trusted by multiple government agencies, defense institutes, retail megacorps, building material manufacturers and agribusinesses
2. Palantir Foundry
Overview: Palantir Foundry is a data integration and analytics platform that offers end-to-end capabilities, data lineage, virtualization tools, and scalability. It is designed to help organizations manage and analyze data from various sources, providing insights for better decision-making.
Main Features:
- Data lineage
- Virtualization tool
- Scalability
Main Benefits:
- Excellent security with granular control
- Data lineage and virtualization tools
3. SAP Supply Chain Analytics Software
Overview: Part of SAP’s broader suite, SAP Supply Chain Analytics Software, is a comprehensive solution for supply chain planning, logistics, manufacturing, lifecycle management, and asset management. It helps businesses optimize costs, achieve revenue growth, and improve supply chain efficiency through advanced planning and optimization features.
Main Features:
- AI-powered demand forecasting
- Advanced planning and optimization (APO)
- Predictive maintenance
Main Benefits:
- Widely used among supply chain professionals and a 19% global market share
- Easy integrations for those already using SAP solutions
- Upgradability and multiple forecast modeling techniques
4. Oracle Fusion SCM Analytics
Overview: A module within Oracle’s Cloud SCM, Oracle Fusion Supply Chain Management Analytics, can detect, understand and resolve supply chain problems faster using a pre-built analytics model.
Main Features:
- Pre-built KPI library
- Add third-party data sources
- Self-service tools for report creation
Main Benefits:
- Rapid implementation in the Oracle SCM ecosystem
- Visibility into cost-saving opportunities
- Correlate supply chain operations with business outcomes
5. Blue Yonder
Overview: Blue Yonder is a suite of integrated solutions for supply chain planning, inventory optimization, and demand forecasting built for manufacturers and retailers. It helps businesses optimize their supply chain operations, reduce costs, and improve customer satisfaction.

Main Features:
- Generative AI
- Unified data model
- Domain-enriched UI component library
Main Benefits:
- Comprehensive suite of integrated solutions
- Advanced analytics capabilities
6. Manhattan Associates
Overview: Manhattan Associates is a supply chain software that engages analytics to provide insights to improve customer experience. From inventory management, order management, subledger, and financial process features to store inventory and fulfillment, Manhattan Associates brings planning and execution together on a single platform.
Main Features:
- Customizable dashboards for supply chain performance
- Delivery alerts for customer satisfaction
- Order management
Main Benefits:
- Supports omnichannel commerce
- Low-code tool
- Focus on customer service
7. Tableau
Overview: Tableau is a data visualization and analytics tool built focusing on manufacturing, production, and logistics. It provides insights for better decision-making and improved capacity planning, inventory management, and delivery.

Main Features:
- Data visualization
- Integration with other systems
Main Benefits:
- Intuitive interface
- Wide range of data visualization options
- Strong community support
8. GMDH Streamline
Overview: GMDH Streamline is a supply chain planning software that engages predictive analytics and is designed primarily for manufacturers, distributors, retailers, and ecommerce brands. It offers visibility to manufacturers to manage day-to-day production, distributors to maintain inventory levels, and retailers to avoid stockouts.
Main Features:
- Integrates with multiple ERPs
- Multi-echelon planning
- Visibility into operations
Main Benefits:
- Replaces Excel sheet
- Designed for day-to-day operational management
- Faster planning
9. IBM Supply Chain Analytics
Overview: IBM Supply Chain Analytics is an AI-enabled supply chain planning software that uses analytics to help businesses make data-driven decisions and improve their supply chain operations. It offers demand forecasting, inventory optimization, and logistics planning features.

Main Features:
- Single centralized platform
- Use of real-time internal and external data
- Multiple business partner solutions
Main Benefits:
- Enterprise-wide collaboration
- More accurate sales and operations plans
- Cut downtime for data analysis
10. Supply Chain Guru X by Coupa
Overview: Supply Chain Guru X by Coupa is a cloud-based supply chain analytics solution that visualizes, optimizes, simulates, and analyzes supply chains for risk mitigation, sustainability and cost improvements.
Main Features:
- Supply chain simulation
- Scenario analysis
Main Benefits:
- Risk management
- Better adaptability
- Product evolution
11. Kinaxis RapidResponse
Overview: Kinaxis RapidResponse is a supply chain planning and analytics solution that empowers businesses with real-time insights and scenario-based planning capabilities.
Main Features:
- Scenario simulation
- End-to-end synchronization
- AI-driven insights
Main Benefits:
- Risk mitigation
- Resilience
- Optimized operations
12. O9 Solutions
Overview: O9 Solutions is a digital platform that provides end-to-end visibility and actionable insights across supply chains. With advanced AI and machine learning capabilities, O9 Solutions enables demand forecasting, inventory optimization, and scenario analysis.

Main Features:
- Integrated planning
- Scenario simulation
- Patented graph-based technology
Main Benefits:
- Better collaboration with business teams
- High security and encryption services
- Scalability
13. Anaplan
Overview: Anaplan is a cloud-based supply chain planning and analytics platform that empowers businesses to connect data, people, and plans across the supply chain for enhanced visibility and agility. Anaplan PlanIQ is integrated with Artificial Intelligence and Machine Learning for better results.
Main Features:
- Intuitive user interface
- Advanced analytics functions
- What-if analysis
Main Benefits:
- Enterprise-wide intelligence
- Recommendations for complicated use cases
14. Qlik
Overview: Qlik is a data analytics and visualization platform that empowers supply chain professionals with insights to drive informed decisions. Qlik enables users to analyze supply chain data from various sources, uncover patterns, and gain actionable insights through its intuitive data discovery and visualization capabilities.
Main Features:
- Data visualization
- Self-service analytics
Main Benefits:
- Insightful decision making
- Better inter-functional collaboration
15. SAS Viya Supply Chain Analytics
Overview: SAS Viya is an analytics platform that empowers supply chain professionals to harness the power of advanced analytics and artificial intelligence for optimizing supply chain operations. With its cloud-native architecture, SAS Viya offers real-time insights, predictive modeling, and machine learning capabilities.
Main Features:
- Advanced analytics
- Model deployment
Main Benefits:
- Scalable
- Faster decisions
16. AERA Technology
Overview: The AERA Decision Cloud digitizes, augments, and automates complex decision-making in the supply chain using advanced analytics.

Main Features:
- Dynamic cognitive processes
- Pre-packaged algorithms
Main Benefits:
- Self-service platform
- Scalable
17. Conversight
Overview:
Conversight is a company that aims to humanize the interaction between people and data, focusing on providing conversational insights and analytics through its AI platform. Their AI assistant, Athena, understands user behavior, context, and intent to offer personalized insights and actions.
Main Features:
- Data democratization
- Embedded analytics
Main Benefits:
- real-time insights
- predictive analytics
- advanced reporting capabilities
- personalized insights and actions to optimize supply chain management, planning, and execution
18. Tredence
Overview: Tredence is a data science and analytics company that partners with organizations to drive data-driven decision-making in their supply chain operations. Through their expertise in analytics, Tredence offers tailored solutions that enhance supply chain visibility, optimize processes, and facilitate proactive strategic planning.
Main Features:
- Data visualization
- Advanced analytics
Main Benefits:
- Strategic planning
- Agile operations
What are the Benefits of Using Supply Chain Analytics Tools for Businesses?
Supply chain analytics is so much more than a simple data overview. Supply chain analytics tools can improve every aspect of your supply chain, including capacity planning, inventory levels, demand sensing, and your business’s net profits.
Some of the key benefits of using a supply chain analytics tool include:
- Data-driven decision-making: By consolidating and analyzing data from various sources, supply chain analytics tools can enable you to make informed decisions based on accurate and reliable information.
- Increased visibility: Supply chain analytics tools can provide a comprehensive view of your entire supply chain, allowing businesses to identify bottlenecks, inefficiencies, and areas for improvement from a larger and more informed perspective.
- Improved efficiency: A well-oiled supply chain is an efficient one. When analytics software identifies bottlenecks, inefficiencies, and redundancies, it allows you to optimize processes. Whether trimming excess inventory or streamlining production schedules, efficiency is a definite by-product.
- Cost savings: Efficiency leads to savings. Supply chain analytics software helps you cut unnecessary costs by identifying areas where resources are wasted. This could mean reducing inventory holding costs, minimizing transportation expenses, or identifying alternative suppliers.
- Swift problem resolution: Disruptions are the reality of supply chains. With supply chain analytics software, you’re not just reacting to problems but proactively tackling them. Real-time monitoring and alerts ensure you’re the first to know about any deviations, giving you a head start in finding solutions.
- Strategic insights: Analytics software doesn’t just deal with the present; it’s a crystal ball into the future. Identifying trends and patterns provides strategic insights that guide long-term planning and goal setting.
- In a world where speed and efficiency are vital differentiators, supply chain analytics software gives you an edge. You stay ahead of the curve by making informed decisions faster, adapting to market changes swiftly, and optimizing your processes.
What are Data Visualization Techniques for Effective Decision-making in Supply Chain?
Data visualization makes the insights drawn from data accessible to one and all. Visualization is an essential feature in any supply chain analytics tool. Some effective data visualization techniques include:
- Charts and graphs: Visual representations such as line graphs, bar charts, and pie charts provide a clear overview of key performance indicators (KPIs) and trends, enabling stakeholders to identify areas for improvement.

- Heatmaps: Heatmaps visually depict data density and patterns. Stakeholders can quickly pinpoint operational bottlenecks and take necessary actions by identifying hotspots and outliers.
- Geospatial mapping: Mapping supply chain data on geographic maps allows for visualizing distribution networks, identifying regional performance variations, and optimizing logistics and transportation routes.

- Sankey diagrams: Sankey diagrams are valuable tools in supply chain analytics for visualizing the flow of resources, materials, or information within a complex supply chain network. They help illustrate the movement and distribution of various components and resources at different supply chain stages.

With proper data visualization techniques, supply chain analytics software empowers every stakeholder to interpret complex datasets, gain insights, and make data-driven decisions.
How to Run Expense Management and Cost Optimization Using Supply Chain Analytics Software?
If there’s anything that businesses expect from supply chain leaders right now, it is to optimize costs and boost revenue. A good supply chain analytics software plays a crucial role in identifying cost-saving opportunities and improving the overall efficiency of the supply chain.
Role of supply chain analytics software in identifying cost-saving opportunities
A good supply chain analytics software can enable businesses to analyze vast amounts of data and identify areas where costs can be reduced. Businesses can gain valuable insights into cost-saving opportunities by integrating data from various sources such as transportation, procurement, and inventory.
For example, by analyzing historical transportation data, businesses can identify routes or carriers that are more cost-effective. They can also optimize inventory levels to reduce carrying costs while minimizing stock-outs. These insights enable businesses to make informed decisions that result in significant cost savings.

Analyzing and optimizing transportation, distribution, and warehouse costs
A smart supply chain analytics software allows businesses to analyze and optimize transportation, distribution, and warehouse costs. Companies can identify inefficiencies and implement corrective measures by collecting and analyzing data related to transportation routes, fuel prices, and carrier performance.
Additionally, the software can help optimize distribution and warehouse costs by analyzing factors such as order fulfillment time, storage utilization, and labor productivity. Companies with complex supply chains can enhance their profitability and competitiveness by identifying areas where costs can be reduced and operations can be optimized.
What is the Role of Performance Tracking and Metrics in Supply Chain Analytics Software?
Performance tracking and metrics play a crucial role in the success of any supply chain. With the help of supply chain analytics software, businesses can now effectively measure and monitor their performance to make data-driven decisions.
Key performance indicators (KPIs) for measuring supply chain success
Supply chain analytics software provides a comprehensive set of key performance indicators (KPIs) that help businesses evaluate their supply chain performance. These KPIs include:
- On-time delivery: Measures the percentage of orders delivered on time.
- Order fulfillment cycle time: Calculates the time taken to fulfill an order.
- Inventory turnover: Evaluates how quickly inventory is sold and replenished.
- Supplier performance: Assesses the performance of suppliers in meeting quality and delivery standards.
- Cash-to-cash cycle time: Measures the time it takes for cash to flow from purchasing raw materials to collecting funds from customers.
Real-time visibility and tracking of metrics through analytics dashboards
Supply chain analytics software offers real-time visibility and tracking of metrics through interactive supply chain analytics dashboards. These dashboards provide a clear and concise overview of key metrics, allowing businesses to monitor their performance anytime.
With customizable views and real-time updates, decision-makers can quickly identify trends, spot bottlenecks, and track progress toward goals.
Using analytics to identify potential bottlenecks and improve performance
By leveraging the power of analytics, supply chain analytics software helps businesses identify potential bottlenecks and inefficiencies within their supply chain. Advanced analytics algorithms analyze large datasets to uncover patterns, trends, and anomalies.
C-suite staff can then use these insights to optimize their supply chain operations, improve efficiency, and enhance overall performance.
What are the Best Practices for Implementing Supply Chain Analytics Software?
Here’s what you already know: Implementing supply chain analytics software can provide you with valuable insights and a competitive edge. However, successful implementation and integration require careful planning and consideration.
Here are some steps, challenges, and best practices to guide you.
Steps for successful implementation and integration
While these steps are not mandatory, following them will make your life easier.
- Define your goals: Identify what you aim to achieve with the supply chain analytics software. Outline specific objectives and key performance indicators (KPIs) immediately.
- Assess your data infrastructure: Evaluate your existing data infrastructure and capabilities. Ensure it can handle the volume and complexity of data required for effective analytics.
- Data cleansing and integration: Cleanse and integrate your data from various sources into a comprehensive database. Ensure data accuracy and consistency.
- Select the right software: Research and select a supply chain analytics software solution that aligns with your needs and goals. Consider factors such as functionality, scalability, and ease of use.
- Pilot test and validate: Conduct a pilot test before full implementation to assess the software’s effectiveness and identify any potential issues. Validate the results and make necessary adjustments.
- Train your staff: Provide thorough training on effectively using the software. Ensure the staff understands its capabilities and how it can support their decision-making processes.
- Phased implementation: Roll out the software in phases rather than a single, large-scale deployment. This approach allows for easier troubleshooting and reduces disruption to ongoing operations.
- Monitor and refine: Continuously monitor the software’s performance and make refinements as needed. Regularly review and update your analytics strategies to align with your evolving business goals.

Addressing challenges and overcoming resistance during software adoption
You’re bound to face some resistance while implementing any tool. There are budgets involved, changes in familiar ways of working and a steep learning curve for multiple stakeholders. Some of the things you might expect to happen include:
- Resistance to change can come from current employees. Here’s how you can deal with it: address the benefits through effective change management strategies. Communicate the benefits of the software and involve employees in the decision-making process.
- Integration with existing legacy systems can be complex. Collaborate with IT professionals to ensure seamless integration and minimize disruption.
- Develop robust data security measures to protect sensitive information. Adhere to data privacy regulations and industry best practices.
- Involve key stakeholders throughout the implementation process to gain support and meet their needs.
Best practices for training, user adoption, and ongoing support
With all being said, some best practices will ensure a higher probability of software adoption:
- Provide comprehensive training: Offer training sessions covering software functionality and how it can be practically applied in daily operations.
- Foster a culture of analytics: Encourage employees to embrace analytics as part of their decision-making process. Provide ongoing support and encourage knowledge sharing.
- Establish a support system: Create a support team or help desk to promptly address user queries and provide technical assistance.
- Stay updated with software upgrades: Regularly update the software to benefit from new features and enhancements. Maintain a clear roadmap for future improvements.
Following these steps and best practices will help you successfully integrate supply chain analytics software into your operations, unlocking valuable insights and driving performance improvements.
What are the Future Trends in Supply Chain Analytics Tools?
The field of supply chain analytics software is constantly evolving, driven by the advancements in technology and the changing needs of businesses.
Here are some future trends that will shape the landscape of supply chain analytics software:
Exploration of emerging technologies shaping the future of supply chain analytics
As technology advances, new and emerging technologies such as blockchain, Internet of Things (IoT), and advanced analytics will play a significant role in shaping the future of supply chain analytics software.
These technologies have the potential to provide real-time visibility, enhance data accuracy, and improve collaboration among different stakeholders in the supply chain while providing the opportunity to automate decisions in the supply chain.
Potential implications of artificial intelligence and machine learning on analytics
Artificial intelligence (AI) and machine learning (ML) have already started making their mark in supply chain analytics software. AI and ML algorithms can process large volumes of data faster, identify patterns, and generate actionable insights. In the future, AI and ML will become even more sophisticated, enabling advanced cognitive analytics and automation in supply chain decision-making processes.
Predictive analytics and prescriptive insights for proactive decision-making
Supply chain analytics software will increasingly focus on predictive and prescriptive analytics, leveraging historical data and algorithms to forecast future demand, optimize inventory levels and improve planning processes.
Additionally, prescriptive insights will enable businesses to proactively identify and act on potential risks, bottlenecks, and inefficiencies in the supply chain and take proactive measures to mitigate them.
As supply chains become more complex and dynamic, the demand for advanced supply chain analytics software will continue to grow.
Enterprises harnessing these emerging trends’ power will gain a competitive advantage, improve operational efficiency, and make informed decisions to drive their supply chain performance to new heights.
Final Thoughts
Improved decision-making is a crucial priority for supply chain leaders. Undoubtedly, more and more leaders will turn to supply chain analytics software to support, augment, and automate their decisions. It’s like having a trusted compass guiding you through the complexities.
This software will open doors to precious insights, steering you toward data-backed choices that fine-tune your supply chain dynamics.
Embracing supply chain analytics tools is more than a suggestion; it’s wise. The results are like an orchestra playing in harmony when woven into your supply chain strategies. Analytics becomes your conductor, orchestrating processes, trimming costs, elevating performance, and taming uncertainties.
So, as you embark on this journey, remember to explore the cream-of-the-crop solutions we’ve laid out above. The significance of supply chain analytics software will only escalate in the future, and we firmly believe that ThroughPut offers the cutting-edge advantage needed by supply chain aficionados today and in the promising times ahead.

FAQs: What Maintenance and Supply Executives Need to Know Before Investing
Q1: Why can’t we figure out what’s actually slowing down our supply chain performance?
Most supply chains generate huge volumes of operational data across ERP systems, production systems, inventory tools, and logistics platforms. The challenge isn’t a lack of data—it’s the difficulty of identifying which constraint is actually limiting performance.
Traditional dashboards show KPIs but rarely explain the root cause behind them. ThroughPut AI analyzes operational data across the entire supply chain ecosystem to identify the true bottlenecks affecting throughput, inventory flow, and service levels.
By diagnosing constraints across demand, production, and logistics, ThroughPut helps supply chain leaders quickly identify the improvements that will have the largest impact on operational performance and profitability.
Q2: Why do we keep investing in supply chain improvements but don’t see meaningful results?
Many improvement initiatives fail because they focus on symptoms rather than system constraints. Organizations often launch projects around forecasting, inventory reduction, or logistics optimization without understanding which part of the supply chain is actually limiting throughput.
ThroughPut AI addresses this by analyzing the entire operational system and identifying the specific constraints that restrict flow and profitability.
Instead of guessing where improvements are needed, leaders can prioritize initiatives that deliver the highest operational and financial impact, ensuring that supply chain investments translate into measurable business results.
Q3: Why do we still experience production delays even when demand forecasts look accurate?
Accurate demand forecasts alone do not guarantee smooth production. Delays often occur because of capacity limitations, supplier delays, material shortages, or logistics disruptions that aren’t visible early enough.
ThroughPut AI connects demand data with production capacity, supplier lead times, and inventory availability to provide a holistic view of the supply chain system.
By identifying hidden constraints across these variables, the platform helps organizations anticipate disruptions earlier and maintain a smoother production flow.
Q4: Why do supply chain disruptions always seem to surprise us?
Many supply chains detect disruptions only after they occur because monitoring systems focus on historical reporting rather than predictive insights.
ThroughPut AI continuously analyzes operational signals across suppliers, inventory levels, production schedules, and logistics networks. By identifying patterns and anomalies, the platform can highlight potential risks before they escalate.
This proactive visibility allows supply chain leaders to take preventive actions that reduce disruption impact and maintain operational continuity.
Q5: How do we know which supply chain analytics platform will actually deliver value?
Not all analytics tools are designed to improve supply chain performance. Many platforms focus primarily on dashboards or reporting, which provide visibility but not actionable insights.
ThroughPut AI is designed specifically to diagnose root causes of operational inefficiencies and recommend improvements that increase throughput and financial performance.
By linking operational data with metrics such as revenue, working capital, and free cash flow, ThroughPut helps organizations ensure that analytics investments deliver measurable business value.
Q6: How can we get faster insights from our supply chain data instead of waiting weeks for analysis?
In many organizations, supply chain analysis relies heavily on manual reporting and spreadsheet-based analysis. This process slows down decision-making and delays operational improvements.
ThroughPut AI automates this process by analyzing operational data across systems and presenting insights through interactive dashboards and diagnostics tools.
This enables leaders to quickly identify operational issues, test improvement scenarios, and take action without long analysis cycles—allowing supply chain teams to move from reactive reporting to real-time decision intelligence.
Q7: How can I quickly identify bottlenecks in my supply chain without spending months analyzing data?
Identifying supply chain bottlenecks manually often requires extensive data analysis across multiple systems and departments.
ThroughPut AI accelerates this process by automatically analyzing operational data from ERP systems, production lines, inventory platforms, and logistics networks.
The platform highlights the constraints that limit throughput and operational flow, helping leaders focus on the improvements that will generate the fastest and highest ROI.
Q8: Our company already has ERP and BI dashboards. Why do we still struggle to improve supply chain performance?
ERP systems and BI dashboards are excellent for tracking transactions and reporting KPIs, but they typically lack the analytical capabilities needed to diagnose complex operational issues.
ThroughPut AI acts as an intelligence layer on top of existing systems, analyzing relationships between demand, production capacity, inventory levels, and logistics performance.
This allows organizations to move beyond reporting metrics and start identifying the root causes of inefficiencies that impact supply chain performance.
Q9: How can we reduce excess inventory while avoiding stockouts?
Balancing inventory levels across a supply chain is challenging because of fluctuating demand, supplier lead-time variability, and production constraints.
ThroughPut AI analyzes these variables together to identify where inventory buffers are necessary and where capital is unnecessarily tied up.
By aligning inventory decisions with real demand signals and operational constraints, organizations can reduce excess inventory while maintaining high service levels.
Q10: How can supply chain leaders link operational improvements to financial outcomes?
Operational metrics like throughput, lead time, and inventory turnover are often tracked separately from financial performance, making it difficult to measure their true business impact.
ThroughPut AI connects operational performance with financial indicators such as revenue impact, working capital, and free cash flow.
This allows supply chain leaders to clearly demonstrate how operational improvements contribute to overall profitability and business performance.
Q11: How can we detect supply chain disruptions earlier and respond faster?
Supply chains often respond to disruptions only after problems appear, such as delayed shipments or production stoppages.
ThroughPut AI continuously monitors operational data across suppliers, production schedules, and logistics networks to detect patterns that signal potential disruptions.
By identifying risks earlier, organizations can take proactive measures to adjust production plans, reallocate inventory, or secure alternative supply sources.
Q12: How can we improve collaboration between procurement, operations, and logistics teams?
Supply chain decisions often span multiple departments, but fragmented data systems make collaboration difficult.
ThroughPut AI integrates operational data from procurement, production, inventory, and logistics systems into a single source of truth.
This shared visibility allows teams to coordinate decisions more effectively and align actions across the supply chain, improving overall operational efficiency.

